© IEA 2017
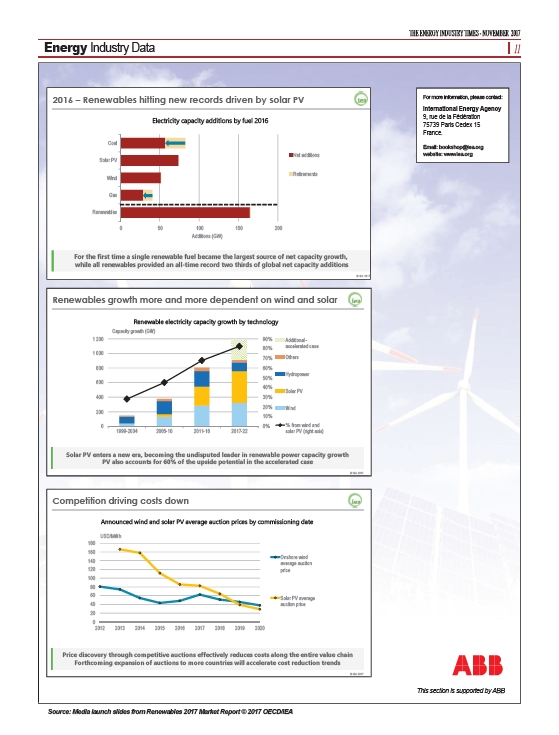
2016 – Renewables hitting new records driven by solar PV
Electricity capacity additions by fuel 2016
0 50 100 150 200
Coal
Solar PV
Wind
Gas
Renewables
Additions (GW)
Net additions
Retirements
For the first time a single renewable fuel became the largest source of net capacity growth,
while all renewables provided an all-time record two thirds of global net capacity additions
© IEA 2017
Renewables growth more and more dependent on wind and solar
Renewable electricity capacity growth by technology
90%
80%
70%
60%
50%
40%
30%
20%
10%
0%
1 200
1 000
800
600
400
200
0
Capacity growth (GW)
1999-2004 2005-10 2011-16 2017-22
Additional -
accelerated case
Others
Hydropower
Solar PV
Wind
% from wind and
solar PV (right axis)
Solar PV enters a new era, becoming the undisputed leader in renewable power capacity growth
PV also accounts for 60% of the upside potential in the accelerated case
Competition driving costs down
Announced wind and solar PV average auction prices by commissioning date
180
160
140
120
100
80
60
40
20
0
USD/MWh
2012 2013 2014 2015 2016 2017 2018 2019 2020
Onshore wind
average auction
price
Solar PV average
auction price
Price discovery through competitive auctions effectively reduces costs along the entire value chain
© IEA 2017
Forthcoming expansion of auctions to more countries will accelerate cost reduction trends
This section is supported by ABB
Source: Media launch slides from Renewables 2017 Market Report © 2017 OECD/IEA
THE ENERGY INDUSTRY TIMES - NOVEMBER 2017
Energy Industry Data 11
For more information, please contact:
International Energy Agency
9, rue de la Fédération
75739 Paris Cedex 15
France.
Email: bookshop@iea.org
website: www.iea.org